
Quick Start: STM32 Development in VS Code
We use Visual Studio Code (VS Code) to keep our C/C++ workflow lightweight, fast, and highly customizable compared to traditional IDEs.
1. Tooling Setup Checklist
Before pulling any project repositories, you need the base environment configured.
Install VS Code
Download and install Visual Studio Code for your operating system. It will serve as our primary editor for everything from firmware to DBC database management.
Install the STM32 Extension
To bridge VS Code with our STM32 hardware and build tools, we use a dedicated extension:
- Open VS Code and navigate to the Extensions view (
Ctrl+Shift+X). - Search for
STM32CubeIDE for Visual Studio Codein the Marketplace. - Click Install.
- Prerequisite: Ensure you also install the official C/C++ Extension Pack by Microsoft for standard IntelliSense, code navigation, and syntax highlighting.
Install the C/C++ Guard Extension
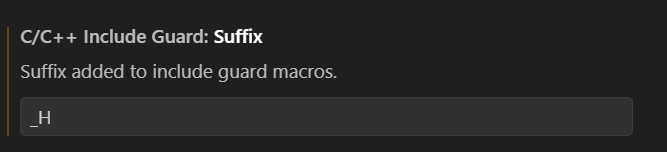
To add guards to header files (#pragma once style, but ISO standard), we use this extension with specific settings:
- Install the
C/C++ Include Guardextension by Akira Miyakoda - Right click on it and pick
Settingsand copy these settings
2. Project setup
DANGER
When opening an STM32 project for the first time, you will be asked to choose between a build or debug configuration. DO NOT CLICK ANYTHING UNTIL THAT WINDOW SHOWS UP AT THE TOP (can be set up later but it's easier this way). Choose debug. When prompted to configure CMake for an STM32Cube project in the bottom right, click Yes.
Example Video
3. Interface Overview
Once the tools are installed and you open one of our firmware repositories, VS Code adapts for embedded development. Here is how you will interact with the IDE daily:
UI Elements
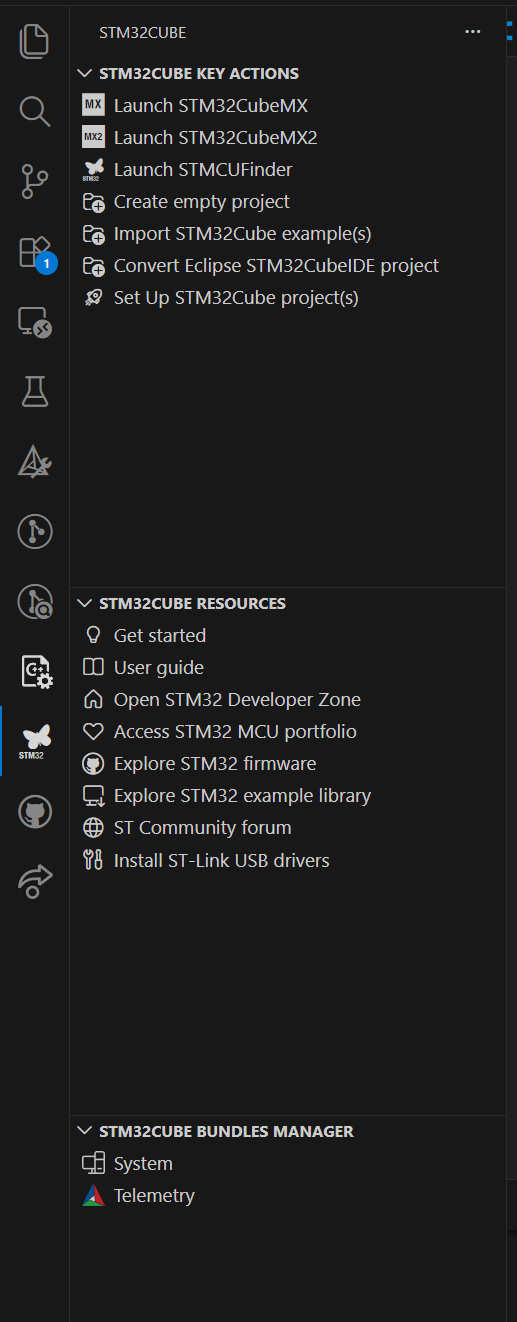
- STM32 Panel (Activity Bar): Look for the STM32 icon on the far left. Clicking this opens a dedicated view where you can manage build configurations, clean the project, and flash code directly to the microcontrollers via ST-Link.
- Explorer view: Your standard file tree. This is where you'll write the application logic, configure RTOS threads, and manage peripheral initializations.
- Status Bar (Bottom): Provides quick-access buttons to
Build,Flash, andDebug. It also displays your currently selected build target.
- Run and Debug (
Ctrl+Shift+D): Where you can enable/disable breakpoints and monitor register values or memory spaces while the board is running. You also have the (Live) Watch sections, where you can see the specific values/expressions you set while the debugger is connected.
Live Watch Config
TIP
To enable live watch, you have to create a launch.json file (from the debugging tab usually) and add the following to the array:
"liveWatch": {
   "enabled": true,
   "samplesPerSecond": "20"
}
4. Repo Layout
Our firmware repositories are typically structured around the specific hardware modules they control (e.g., the Power Distribution Module or the Accumulator BMS). A standard repo includes:
Core/: Contains the main application logic, ThreadX initializations, and our custom code.Drivers/: ST's HAL libraries and low-level system files. The common library also sits here if necessary (most likely)..github/: Contains workflows that reference ORG wide workflows. Copy from other repos, but they should be set up for you already.
Next Steps
Now that your editor is ready, proceed to the following tutorials to learn our standard practices for programming the racecar:
- Team Coding Guidelines: How we structure C/C++ code and manage real-time tasks.
TIP
Always make sure you have the relevant Altium schematics open when assigning pins or writing new peripheral drivers.